


Digest 3 months’ content in 18 minutes
The Google Data Analytics certificate is said to be worth $60,000 because it prepares you for entry-level jobs as a data analyst. Whether that’s true is up to debate but regardless, I decided to take it because I have a thing for data and exploration. And who else to learn about data from other than Google?
The course is divided into steps a data analyst should take when performing analysis.
These steps are
- Foundation — 18hrs
- Ask Data-Driven Questions — 21hrs
- Prepare Data for Exploration — 25hrs
- Process Data from Dirty to Clean — 26hrs
- Analyze Data to Answer Questions — 32hrs
- Share Data Through The Art of Visualization — 25hrs
- Data Analysis with R-programming — 34hrs
- Google Data Analytics Capstone: Complete a case study — 11hrs
We would only be going through the first 4 modules. Why? Well because those are the only ones I have finished lol. Might update this article or create a new one once I complete the remaining 4.
If you ever need help grasping any of these steps, leave a comment or message me on LinkedIn.
Course 1: Foundation
This module lays the groundwork for the necessary skills, tools, and fundamental knowledge a data analyst would need to function properly in the job market.
The module is less technical and more theoretical than others. The main objective is to give you a bird’s eye view of the landscape of a Data Analyst.
What is Analytical Thinking?
Analytical Thinking involves identifying and breaking down a problem in a step-by-step manner in order to find patterns or insights. It involves being problem-oriented, strategic, seeing the forest instead of trees, detail-oriented, and identifying correlations and patterns.
How to think analytically
Most problems often stem from a root cause. By asking and finding out the root cause of a problem, we have solved half of the problem. You can use the 5 whys Principle to help extract the root cause of any problem.
We can also look for gaps in our processes. This is usually used when we want to move from one state to a better one.
We should also consider what wasn’t considered before. By reviewing our steps and analysis, we can properly identify blind spots that weren’t visible initially to us.
Skills Needed as a Data Analyst
Curiosity: As a Data Analyst, curiosity would take you far. Being able to dig through your data till you uncover every aspect of it is a highly desirable skill.
Understanding Context: Context is crucial when it comes to any form of analysis. It enables you to be able to see a given set of data holistically. A random date provides us with no meaningful information except that it’s on the time continuum. But when you specify that it’s when you were born, we can now derive more meaningful information from that and be able to ask further relevant questions.
Technical Mindset: This skill is synonymous with thinking analytically. It requires breaking down complex problems into smaller and simpler parts. It requires us to think logically and creatively when approaching problems.
Data Design: This deals with how you organize your information. For instance, alphabetically arranging contact list information is an example of data design.
Data Strategy: This skill often involves the management of people, tools, and processes in data analysis. You want to ensure you have acquired the right people with the right skill sets, knowledge of the required tools, and a well-planned process to execute properly.
Your data strategy should depend on the dataset and the deliverables of the project. If for instance, your client wants a simple dashboard, Google sheets can be used. But a dashboard that continuously updates itself, then tableau would be the right choice.
The Six Phases of Data Analysis
There are six phases of data analysis, but we’ll only be focusing on three because those are the phases covered in courses 1–4.
Ask Phase: In the ask phase, you ask fundamental questions to understand a certain problem and how to approach it.
It usually involves meeting with stakeholders in order to gain clarity on the objectives of the project. This phase allows you to understand the context in which to approach the problem or derive a solution.
Prepare Phase: This phase involves data collection/gathering. We have to worry about what kind of data we need to gather, the source of the data, how relevant is this data to the business objectives, how much data to collect, etc.
The Ask phase prepares us to attack this phase head-on. Using the answers we gathered in the ask phase, we can properly execute this phase. If we encounter any hiccup, it probably means we probably didn’t ask the right question.
Process Phase: The process phase involves cleaning the data we have gathered. A critical part of this phase is data integrity. We need to ensure the data we are cleaning is reliable and accurate.
Once we ensure data integrity, we can then begin to clean data. This involves handling duplicates, misspellings, invalid data types, null values, and misrepresented values.
Once the data is shiny and ready to use, we can then begin the analyze phase.
Data Lifecycle
Data has its own lifecycle just like all living things. This lifecycle usually begins with planning and ends with archiving or deleting.
Different companies sometimes have different data lifecycles unique to their requirements. For instance, the U.S. Fish and Wildlife Service does not have a delete cycle because historical data is important to them.
Generally though, there are key lifecycles that most companies follow:
- Plan — What kind of data is important to us? What tools are required to get that data? Who is responsible for that data? What are the barriers stopping us from getting the data? How long would it take to get the data? Where can the data be found?
- Capture — We capture the data using tools available to us
- Manage — We maintain and store the data using tools we deem appropriate.
- Analyze — We derive insights from the data and use it to make decisions and solve problems.
- Archive — We archive the data for later use.
- Destroy — We wipe the data from memory and delete any shared copies of the data.
When I was learning this section, it was difficult to separate the six phases of data analysis from the data lifecycle. In order to separate them, let’s look at it this way.
First, the data lifecycle phase is to be adapted and modified based on the company’s needs. It’s just a guiding framework you can use to manage your data.
The sixth phase of data analysis is a process every data analysis project must go through. There’s no skipping the line. Every step of the way is as critical as the first. You are allowed to add some more phases to your liking but the entire six phase stated must be included in your adapted framework.
The data lifecycle is all about the data. What state the data is in, and how it can get to the next state.
The sixth phase of data analysis is all about the problem/objective. How is the state of our data relevant to the problem we are trying to solve and how can it become more relevant?
Course 2 — Ask Questions Make Decisions
At every step of the way in the data analysis process, you are going to need to ask questions. These questions are going to determine the quality of your analysis.
In the Ask phase, questions like “What are the problems I need to solve? How do I go about solving it?” are needed to be asked.
In the Prepare phase, questions like “What kind of data do I need to solve this problem? What are the right tools to get this data? What research do I need to do to understand this problem and it’s context.” would prove invaluable.
In the Process Phase, questions like “What data inaccuracies am I likely to encounter? What tool would help me clean this data efficiently?” would prove invaluable.
In the Analyze Phase, questions like “What is my data telling me? Am I inferring any kind of bias on this data? Who needs my company’s product or services and what type of person would most likely use it?”
In the Share Phase, questions like “How can I visualize this to stakeholders so they can understand it? Who are my target audiences? What would help me understand it if I were the listener? How can I make this engaging?”
In the Act Phase, questions like “How can we use the analysis to improve products or meet stakeholders’ expectations? What and who are needed for the analysis to be acted upon?”
SMART QUESTIONS
A lot about asking good questions is making them SMART. The SMART framework has been used since 1981. It was initially used as a means of setting goals but have now been adopted in different branches of self-development.
The ability to ask and communicate those questions effectively is a very valuable skill in 2024. In a field like Data Science, asking good questions must become second nature to stand out.
- S — Specific — They are significant, and very closely bound to our ideas.
- M — Measurable — They can be quantified.
- A — Action-oriented — They inspire action or change. So rather than asking, “How can we get customers to recycle our product packaging?” You could ask, “What design features will make our packaging easier to recycle?” This brings you answers you can act on.
- R — Relevant — They matter to the problem being tackled.
- T — Time Bound — They have specified timelines or deadlines in which we would get our answers.
You must not always validate your questions in the default chronological order (SMART). For example, I prefer to use relevant to validate my question before anything else. Besides, what does it matter if your question isn’t relevant to the problem being solved? I take this step Relevance, Action-oriented, Time-Bound, Measurable, and Specific. So RATMS.
Most likely if you get the first four, you have a specific enough question. If you get the first 3, it can be easily measurable, and so on. But this is mine. Do you have your own customized framework?
Questions you should avoid at all costs are:
- Leading questions: The weather is cold, isn’t it?
- Close-ended questions: Do you like ice cream?
- Vague Questions: How’s life?
Data-Driven Decisions vs Data-Inspired Decisions
A data analyst professional is critical to decision-making in any company. The ability to turn raw data into insights is highly valuable.
There are two major ways data can be used to make decisions. Data-driven decision-making or data-inspired decision-making. A lot of businesses sometimes mix up the two but they are very different.
Data-Driven Decisions (DDD)
This is when data is used to determine decisions regardless of external opinions or experiences. It simply means using facts to guide decision-making.
This type of decision-making triumphs when there is enough data to support the fact.
When the data is insufficient, the fact is inherently flawed and making decision based on it would most likely result in bad decision making.
Other drawbacks of DDD are reliance on historical data, a tendency to ignore qualitative data, vulnerable to biases during analysis.
Data-Inspired Decisions (DID)
This type of decision involves the entire party. Although similar to DDD, they give room for opinions and suggestions about the decision to be made based on the data. Slight deviations are allowed, experiences are considered, and so on.
DID can also avoid some of the drawbacks that DDD has.
When making decisions with data, there are generally two types of data at play: Qualitative and Quantitative data.
Qualitative data: is data that is often subjective and not measurable. These kinds of data are often non-numerical. They help provide us with context to our quantitative data and are useful to get a more ground understanding of what our data is telling us. We can get qualitative data from focus groups, in-person interviews, reviews and so on.
Quantitative data: is data that is objective and measurable. They can often be in numerical or a structured format. This kind of data helps us spot trends and anomalies in our data. Examples of ways we can get quantitative data includes surveys, polls, ratings, and so on.
You can think of it this way. If there were a group of people in a room, qualitative data could describe how they feel, what they look like, what clothes they are wearing, or their motivations of why they’re here. Whereas quantitative data about the same group may include the number of people in the group, their age, or the temperature in the room.
How to Solve Problems
Before solving any problem, we need to define it properly. There is a famous quote by Albert Einstein that says, “If I were to spend 1 hour solving the world’s problem, I would spend 55 minutes defining the problem and 5 minutes solving it.” This is the degree you need to take to define a problem. You don’t want to spend 5–10 hours solving a problem only to find out it was the wrong problem.
Defining the problem is only one piece of problem-solving. A lot of problem-solving involves thinking structurally. Thinking structurally means understanding the current problem, identifying gaps and opportunities, collecting and organizing information, and defining options available.
A clean way to practice structured thinking is through the scope of work. A scope of work is a document that defines a project’s problem, deliverables, timelines, milestones, and reports. It is an agreed-upon doc that allows any party involved to follow along with the project’s progress.
Do not confuse Scope of work with Statement of work. Statement of work defines what you are contributing to the company/business and what is expected of you. It includes objectives, guidelines, deliverables, schedules, and costs.
In problem-solving, you also need to understand the context related to the data. Numbers on a spreadsheet mean nothing without context. And depending on the context, the data could mean different things. It’s extremely important to be as intimate as possible with the data’s context because it would define the interpretation and result of the analysis.
However, nothing above would be important if we do not understand the limitations of our data.
Limitations of Data
A great DA knows the limitations of his/her data and prepares for them. Some limitations of data can include:
Incomplete/non-existent data: Incomplete data is data restricted by samples, time range, features, etc.
Whenever you encounter incomplete or non-existent data, you want to always be upfront about it with stakeholders. Without the required data, it would be difficult to reach an unbiased conclusion.
Misaligned data: Sometimes, the data you collect could have a different interpretation from what you believe it to be.
For instance, suppose you collect data from another team, and one of the features is number of course participants. You might assume that to be the entire population who enrolled in the course, when in fact, it was only those who completed the course.
So you want to be clear beforehand in order to avoid stories that touch the heart.
Dirty Data: This one should be obvious. You shouldn’t work with dirty data until it’s cleaned.
As a quick reminder, data cleaning is the process of fixing or removing incorrect, corrupted, incorrectly formatted, duplicate, or incomplete data within a dataset.
Tell a clear story: When visualizing data, there are a few things to take note of:
- Compare data of the same data type to avoid inconsistencies.
- Set your Y-Axis to 0. It’s easy to see a 0.01 change as a major change when it is zoomed in.
- If your table is clearer without graphs, please don’t add graphs.
- Test for statistical significance. Sometimes two datasets will look different, but you will need a way to test whether the difference is real and important.
- Pay attention to the sample size of your data. Too little can skew results. Always try to collect more data.
Be the Judge: When you know the limitations of your data, it becomes easy to make sound judgments and allow for good decisions to be made in the company. Take the necessary steps to ensure your data is viable to use and make sound judgments.
COURSE 3 — Preparation Data For Exploration
Before we do anything with data, we need to ensure we have the right data. This involves going back to the ask phase and asking questions that narrow down the type of data to collect.
For instance, What type of data would be appropriate? What data would I use? How can I get this data? Is his data relevant to the problem at hand? Where would I need to store this data? What would be my data sources? How much data is needed?
All these questions help narrow down your options and help make data preparation as efficient as possible.
How to decide which data source is reliable?
- Good data sources are reliable
- They are original. Validate the data with the original source.
- They are comprehensive. They contain all the necessary population data.
- They are current and up-to-date. The more stale a data source is, the more the quality of the data decreases.
- They are properly cited.
Types of data sources
First Party Data: This is data that you created using your own resources. For instance through surveys or website registrations. This is the most reliable source of data.
Second Party Data: This is data gotten from an external source who created/owns the data. For instance, Using Facebook API to get data on specific profiles.
Third Party Data: This is data that was gotten from an external source who doesn’t own the data i.e. it was gotten from another provider. This is the least reliable source of data among the three and should be avoided if possible. For example, buying a list of emails from a broker.
Depending on your use case, you can use any of the above data sources. However, third-party data should be considered when the consequences of incorrect data are low.
What type of data to collect?
There are majorly two types of data. Quantitative and Qualitative data.
Qualitative data
Qualitative data is data that cannot be measured or quantified. Examples are names, categories, genres, reviews, etc. They are usually subjective. Types of qualitative data are Nominal and Ordinal Data.
- Nominal Data is data that is categorized without a set order. Examples include Yes/No and Not-Sure questions, sex/gender, etc. These type of questions can be chosen in any order and there’s no dependence between the possible answers.
- Ordinal Data is data that is categorized within a set of orders or scales. Examples include the scale of 1–10 questions, ratings, Size of a shirt, etc. The possible values have a dependency on each other in the sense that one is bigger or smaller than the other.
Quantitative data
Quantitative data is data that can be measured and quantified. Examples are ratings, age, height, time, length, etc. There are different categories of quantitative data which include: Discrete, Continuous, Nominal, and Ordinal data types.
- Discrete data is quantitative data that has a limited number of values i.e. no continuous decimal places. Eg dollar bill, ratings, Maximum capacity allowed in an arena, etc.
- Continuous Data is a type of quantitative data that can have almost any numeric value and can have as many decimal values as possible. Examples include height, temperature, time, etc.
Internal data
This is data gathered within the company. It is the most secure and reliable source of data.
External data
External data is data obtained from outside the data. It becomes important when your analysis depends on as many sources as possible.
Structured data
Structured data is data organized in a certain format, like rows and columns. Eg tax returns, expense reports, etc.
Unstructured data
Unstructured data is data that cannot be stored as columns and rows in a relational database. Eg social media posts, emails, texts, etc.
During the collection of data, we need to ensure we include the metadata on the data.
Metadata
Metadata is data about data. It helps signify how and where data was created/collected. Some examples of metadata include the properties of a PNG file (created, size, ratio, etc).
Emails also contain hidden metadata that includes server names, IP addresses, HTML format, and software details. This image includes hidden email metadata such as the message ID and when the email was created.
This metadata helps data analysts to put data in context. It also helps them determine when data is accurate, precise, reliable, relevant, and timely. It is even more important than the data itself.
Metadata helps analysts ensure that they’re working with the right data and that the data is described correctly.
For example, a data analyst completing a project with data from 2022 can use metadata to easily determine if they should use data from a particular file.
Data Bias
Data Bias is data that skews results in a certain way. There are different forms of bias.
Some examples include –
- Sampling Bias: is when a sample of a dataset isn’t representative of the population. This can be avoided by choosing samples at random.
- Observer Bias: is when different people observe the same thing differently.
- Interpreter Bias: is the tendency to interpret situations or data positively or negatively.
- Confirmation Bias: is the tendency to identify or look for information that confirms our pre-existing knowledge/beliefs.
Before, during, and after the collection of data, we need to follow certain standards that protect the owners of the data. These standards are called Data Ethics.
Data Ethics
Data ethics is a set of rules and principles that should be adhered to when collecting, sharing, and using data. Some aspects of data ethics are consent, privacy, openness, transparency, and currency (being aware of how your data is used financially).
Balance security and analytics
Data security is the security measures we take to protect data from unauthorized access. The best way to secure data is to not collect it in the first place. But that doesn’t help analysts solve problems in any way.
So we want to find some balance between security and our analysis. Our data must be secured but in a way that also allows us to easily retrieve and use it.
Some common methods we can use are encryption, tokenization, authentication, authorization, etc. There are much other methods we can use to secure data but these are popular and well tested methods.
COURSE 4 — Process Data From Dirty To Clean
Data integrity is critical to successful analysis. This usually involves ensuring your data is clean, accurate, trustworthy, and reliable.
There are many ways your data could get compromised during analysis. Data can be compromised when it’s replicated, transformed, manipulated, transferred, etc. It can also be corrupted due to hacking or software issues/malfunction.
This is why you want to always ensure you have a backup of the original data. Never work on the original data. Instead, create a copy and work on that copy.
This gives you the option to revert changes if the need ever arises. It also helps you and everyone understand where and how the analysis is derived from.
Types Of Dirty Data
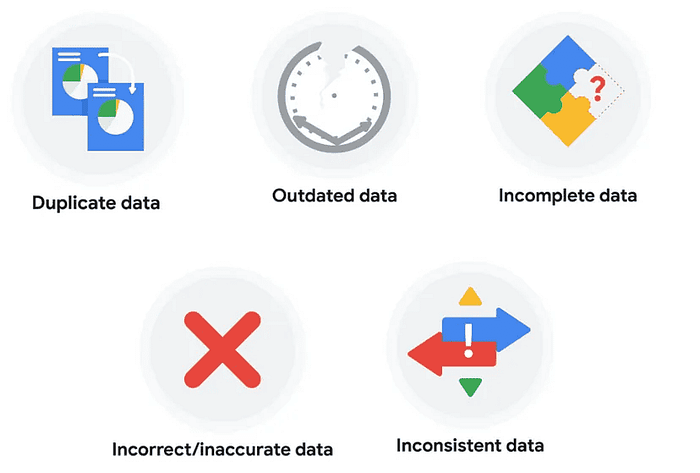
In data analysis, small mistakes in data can lead to big consequences.
So always take the time to clean up the data and soon enough it’ll become a habit, a second nature.
What to do when you find an issue with your data
I’m sure you’re all familiar with the term proxy. According to Google, A proxy is something/someone that has the authority to represent someone else.
When dealing with faulty/missing data, we can always resort to proxy data. This is data that closely relates to the original data.
No Data Issue
Suppose, we are performing an analysis on traffic in cities based in the US, but we do not have any data concerning a certain city.
Rather than excluding that data or spending exorbitant resources to collect that data ourselves, we could just use a city that has the same population as the city we do not have data on.
This is usually the common way of approaching such problems and saves us time.
Missing Data Issue
Suppose you are performing an analysis on loneliness crisis and there isn’t any data for those aged 18–24. You can perform the analysis but when reporting, state that the analysis only includes those aged 25 and above.
If there isn’t a clear group or category that is missing, or just random features are missing for random people, use proxy data to fill them up.
Wrong Data Issue
If you are performing an analysis on a certain data and find that some data results in errors when performing calculations on them, if the data set is large enough and the errors are infrequent relative to the size of the dataset, you can ignore the errors and performing your analysis.
If you have the wrong data because of misunderstood requirements, then get clearer on the requirements.
Important note: Sometimes data with errors can be a warning sign that the data isn’t reliable. Use your best judgment.

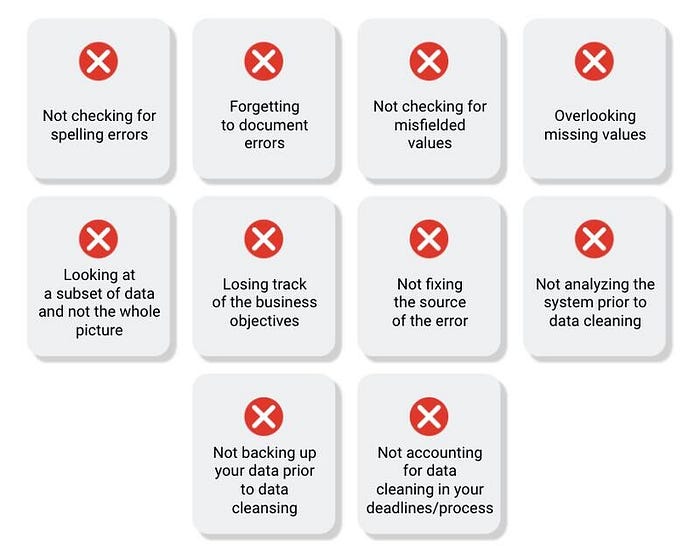
Common data-cleaning pitfalls
I believe an image says a thousand words:
Document the cleaning process
As a data analyst, it’s important you document your cleaning process in order for everyone who encounters the data to see the changes that lead up to it and also fix errors.
This documentation usually includes:
- The date of change.
- The person who made the change.
- Why the change was made.
- The person who approved the change.
- Data, files, formats, etc. that were changed.
- Version Number.
- Description of the change.
Let’s say you made a change to a formula in a spreadsheet because you observed it in another report and you wanted your data to match and be consistent.
If you found out later that the report was actually using the wrong formula, an automated version history would help you undo the change. But if you also recorded the reason for the change in a changelog, you could go back to the creators of the report and let them know about the incorrect formula.
If the change happened a while ago, you might not remember who to follow up with. Fortunately, your changelog will have that information ready for you!
Here are a few things to note:
The release date of each version should be noted
Changelogs are for humans, not machines, so write legibly.
Each change should be on a different line
Group the same types of changes. For example, Fixed should be grouped separately from Added.


One thought on “I Summarized 3 Months Google Data Analytics Course in 18 Minutes”